
From your Products tab, find the product you wish to reformulate, open the three dot menu and select 'Model changes'.

Only complete products can be modelled. If a product is a draft, modelling will be disabled. Make sure you resolve all errors in your reference product before trying to reformulate it.
This will open an interface similar to the product creation flow, showing the selected product and allowing you to model changes.
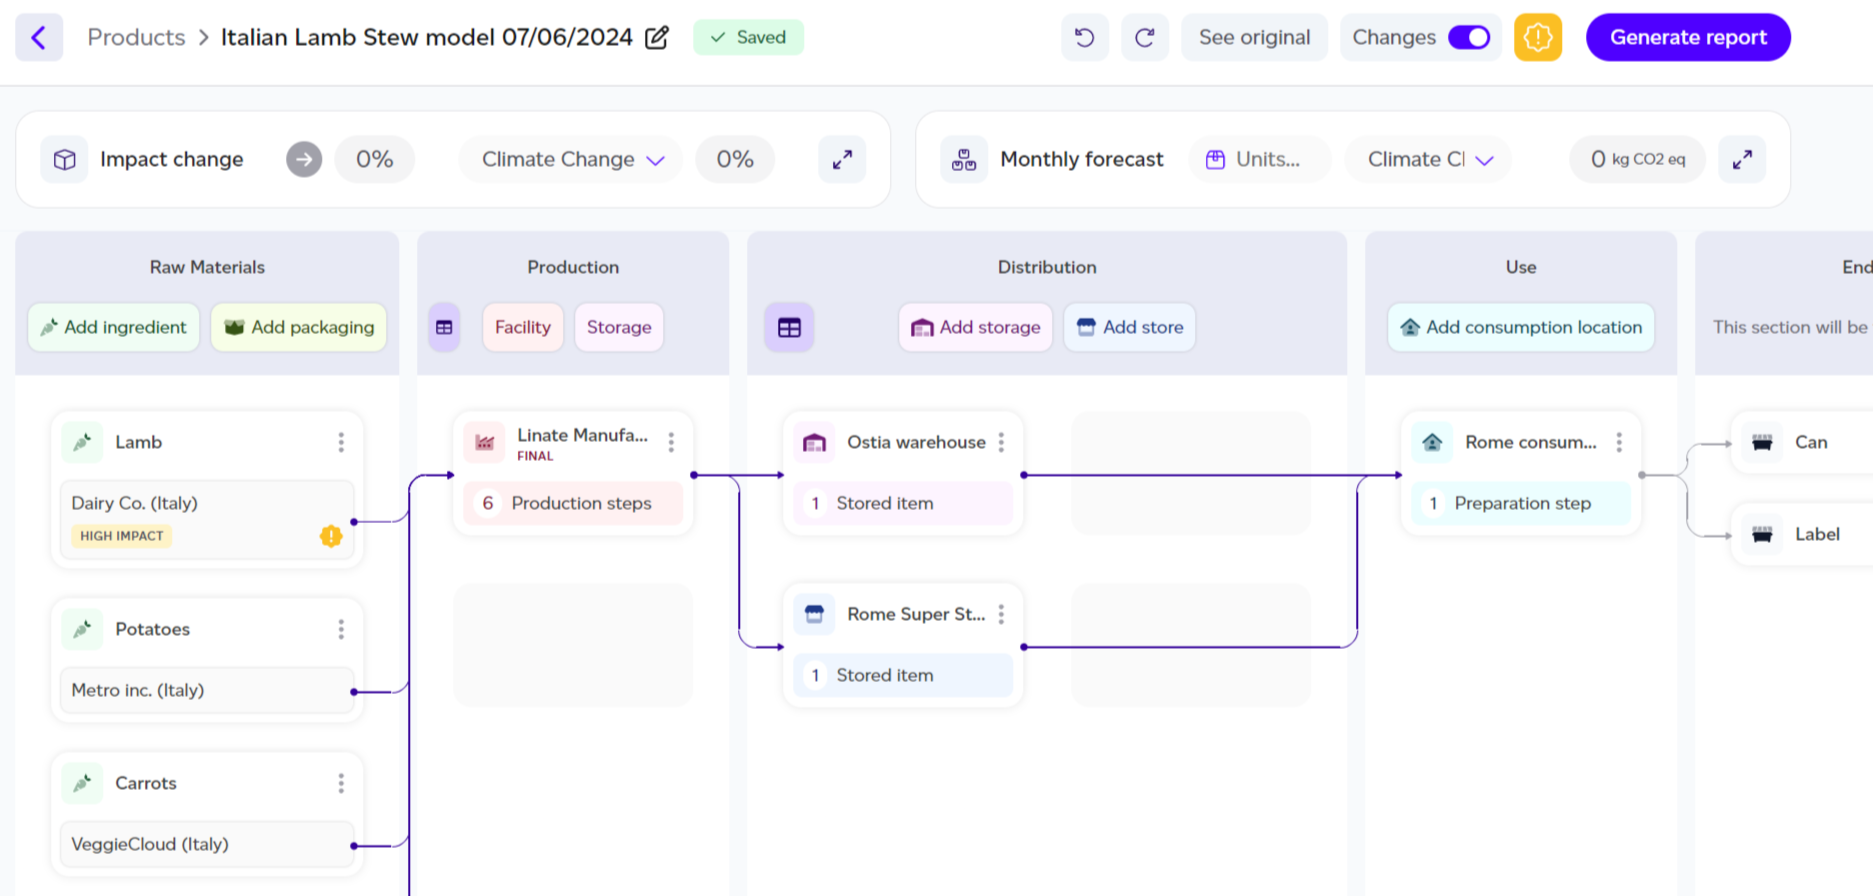
Each component of the product that offers the highest potential for improvement is highlighted with an orange circular sign and a ‘high impact’ badge. These components guide you to focus on the areas that contribute most to the product’s total environmental impact.
The modelling interface functions similarly to the product creation flow. Across all lifecycle stages, you can:
-
Change any variable of an existing component by clicking on it and selecting or typing a new value.
-
Remove components or steps by following the same process as when creating products.
-
Add new components or steps just like in the product creation flow.
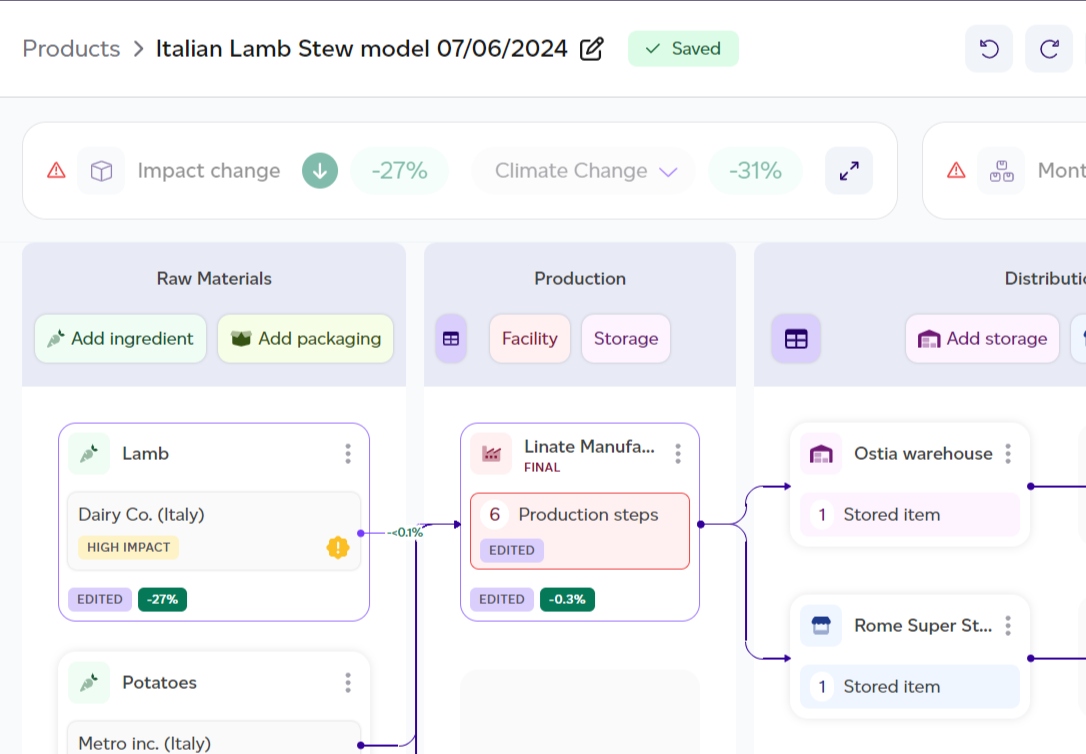
The impact of any changes will be displayed in real-time, either as a badge at the top of the modal or within the component itself on the graph.

As you model you can also view which datasets are in use by clicking on the database icon at any time. This

This will provide you with a view of the dataset name, database, type of dataset (secondary, primary or internal product), the geography of the dataset and comments if available.

Additionally, the cumulative effect of all the changes is shown at the top of the interface. This includes:
-
Total impact change in percentage
-
A dropdown to view the impact change by impact category, with the highest impact category displayed by default
.png)
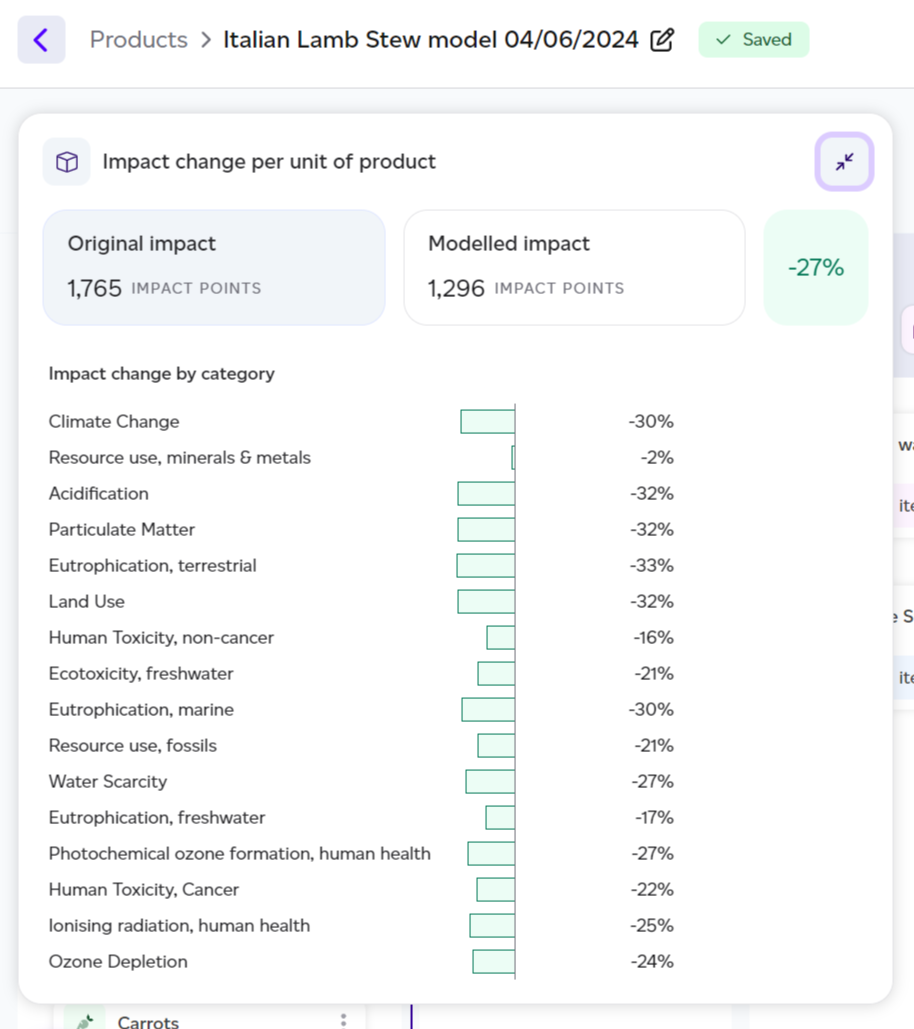
You can expand this section to view more details, such as:
-
Original impact in impact points
-
Modelled impact in impact points
-
Total impact change in percentage (green for a reduction, red for an increase)
-
Impact change by category, showing the percentage change for each impact category
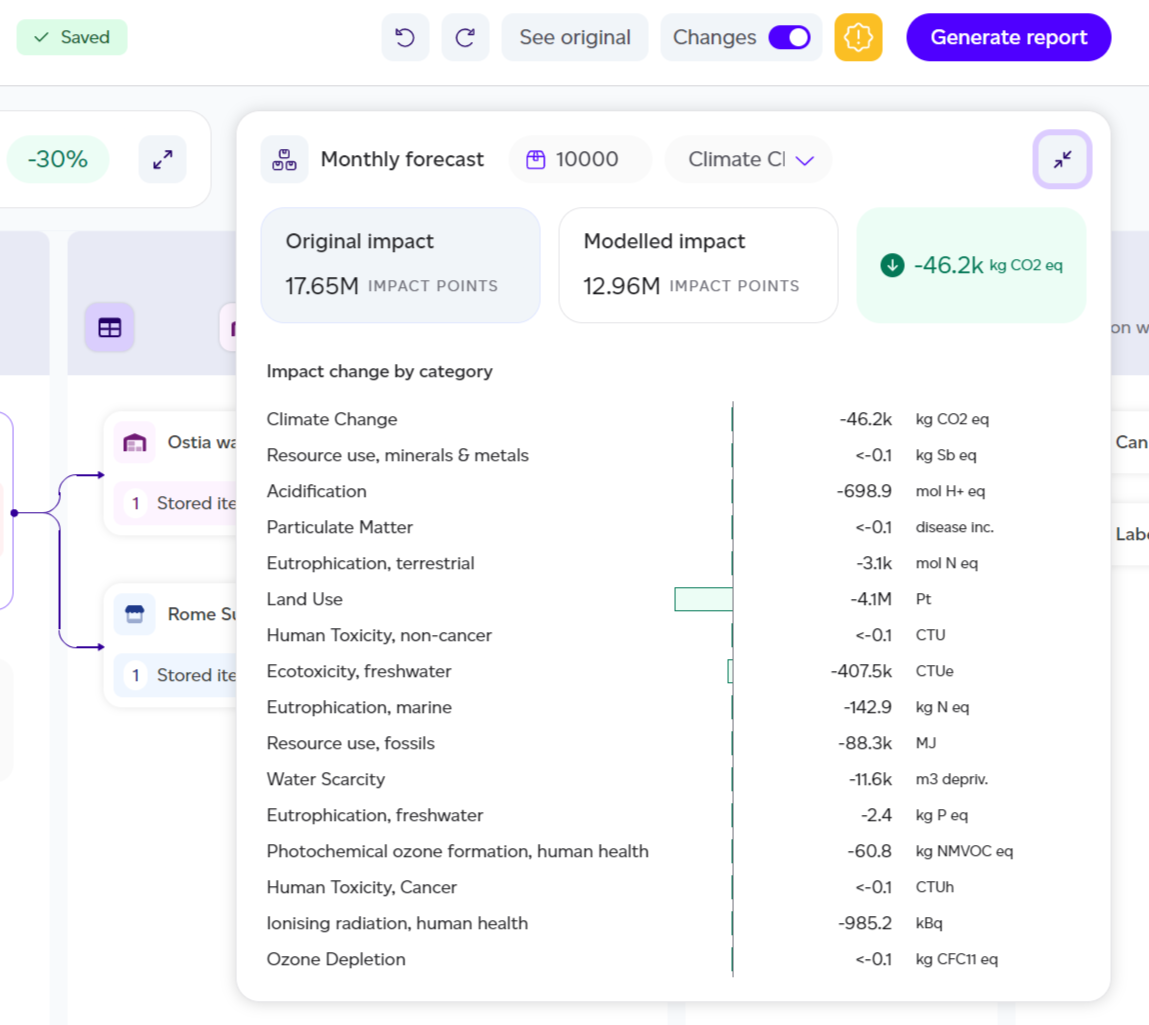
To understand the potential for reduction at scale, you can use the Monthly Forecast feature. By entering the number of units you expect to produce over a month, you can see the total impact change at scale. For example, producing 10,000 units of the modelled product could result in a reduction of 46 tons of CO2e.
On the top-right of the interface, a menu provides additional helpful actions:
- Rename your model by clicking on the pencil icon
- Use the back and forth arrows to undo/redo any changes
- View the original product with the ‘See original’ option.
- Change the lens of the model from the default 'per unit of product' to 'per kg or L' or 'per serving' using the scale icon
- Visualise the new product without impact change badges by toggling ‘Changes’ off.
- View the datasets in use in the modelled product by clicking on the database icon
![]()
Once you’re happy with the changes, click ‘Generate report’. This will generate a PEF-based Impact Change Modelling report, comparing the original product with the newly modelled product, which can be shared internally.