
Once you've authenticated and logged into your account, the first time you access a workspace will prompt you to choose your desired action: reducing the impact of existing products or designing new low-impact products. The onboarding process will then be tailored to your selection.
Upon entering the workspace, one of two tabs will be selected by default, depending on your choice. This will take you to the home dashboard, which provides an overview of the impact of your existing product portfolio. If no product SKUs have been created yet, this section will remain empty.

From here, you can:
-
Resume where you left off if you've previously accessed the platform
-
Create a new product record by clicking the ‘Create new product’ button
If at least one product exists, the dashboard will reflect your progress along the sustainability journey.
Dashboard Overview
The top section of the dashboard offers an overview of your progress and key metrics:
-
Before a baseline is set, you'll see the total number of products in your portfolio compared to your target count, as well as the products with the least first-party data and the highest/lowest impact.
-
After a baseline is set, the first-party data widget remains if your products don’t have 100% first-party data. You’ll also see an overview of your baseline impact, top product contributors, and any targets set.
-
After uploading additional historical data, your progress tracking chart will appear, along with an overview of the latest impact assessment.
.png)
The bottom half of the dashboard guides you step-by-step through your journey within Sustained, for either of the two core use cases:
-
Reducing the impact of existing products
-
Designing new low-impact products
Based on your progress and previous actions, the platform will recommend the logical next step in your journey.
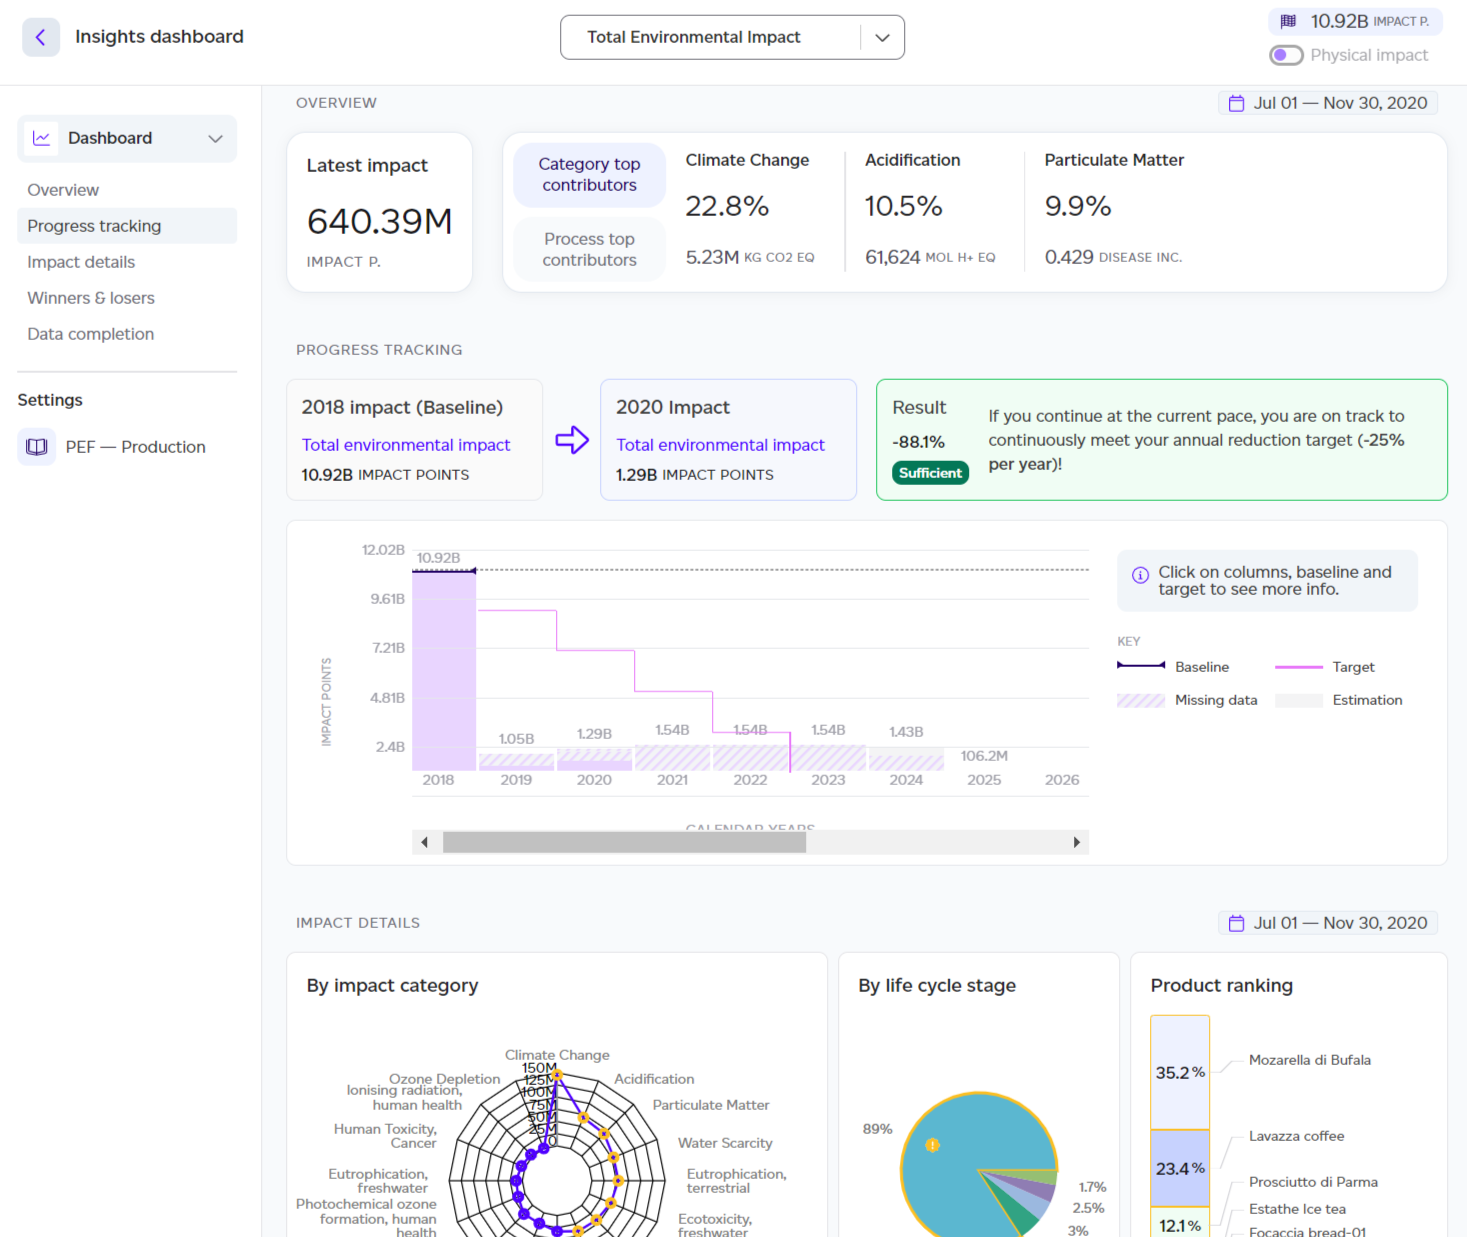
Detailed Insights Dashboard
If there’s at least one product in the platform, you can access more detailed insights by clicking the icon next to ‘Resume where you left off’. This will expand to say ‘Discover all insights’, opening a new dashboard with additional dynamic features tailored to your progress.
If a baseline and historical data have been uploaded, the insights dashboard will display:
-
Overview: Showing the latest impact for the specified timeframe, top category and process contributors, with your baseline impact visible in the top right corner.
-
Progress Tracking: Displays your progress from baseline to future estimations.
-
Impact Details: Provides insights into your latest impact report, broken down by impact categories, life cycles, and product contributions.
-
Winners & Losers: Highlights the best and worst products by volume from your last available volume report.
-
Data Completion: Shows the total number of products in the workspace (draft and complete) compared to the target count, as well as the average first-party data percentage across all products.
If no baseline or historical data is available, the focus will shift to Winners & Losers per unit of product, as no volume data is available for analysis.
Additional Features and Actions
On this dashboard, you can:
-
Toggle Impact Categories: Select one of the 16 PEF impact categories to focus on, or toggle to physical impact.
-
Quick Access: Navigate to specific dashboard sections via the left-hand menu.
-
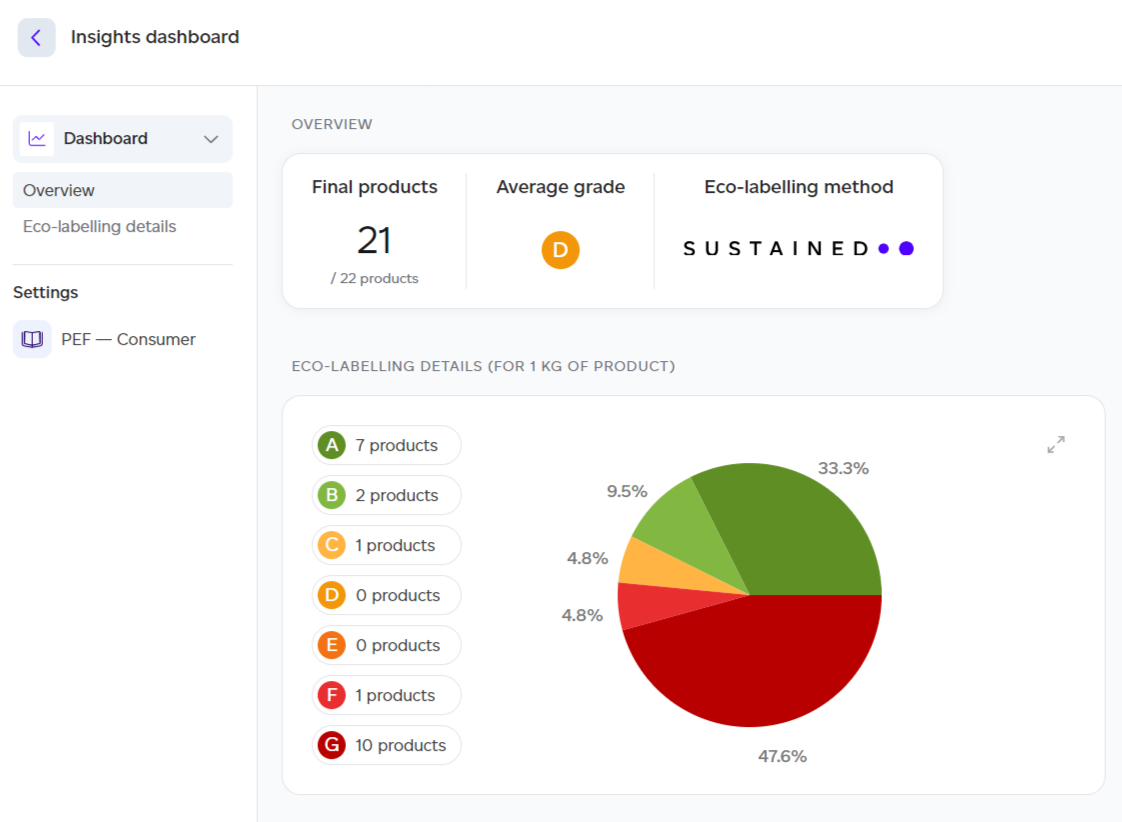
View Different Lenses: Under settings, select one of the three available lenses:
-
PEF - Production: Focused on PEF production insights.
-
PEF - Consumer Impact: Insights for final products, including breakdowns by grade and eco-labelling method.
-
GHG Protocol: Displays results for the workspace, with a focus on GHG emissions (MT CO2e), purchased goods & services impact, and Scope 3 categories. Note that this only covers production-related impacts.
.png)
-