
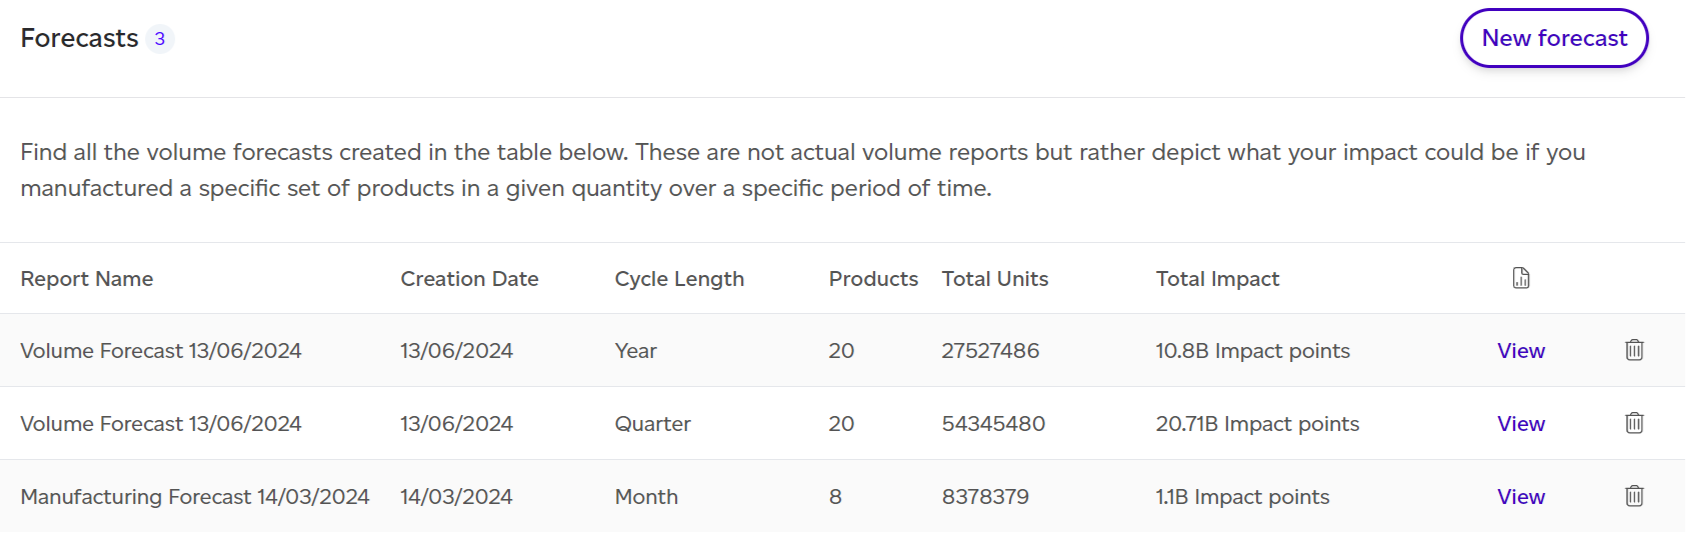
Clicking on Volume in the top menu will open a modal with five choices. If you select Forecasts, you will be redirected to a list of all available forecasts for this workspace. If you already have reports, you can view them by clicking ‘View’ next to the relevant report.
When opening a report, you will land on a dashboard that summarises the insights of the report. This dashboard is automatically displayed for you when viewing a forecast. It includes:
-
Total environmental impact of the manufacturing output
-
Manufacturing output overview: This includes the total number of product SKUs, the total number of units (for all SKUs combined), and the cycle length of the assessment (month, quarter, or year).
-
Top 3 impact categories and processes
-
Top 3 tips to improve your manufacturing output score
-
Baseline comparison: Compares the forecasted impact with the baseline to highlight the differences.
-
Impact difference with baseline: A graph showing actual historical data alongside the forecast, and the target achievement date if any target has been set.
-
Worst offenders: Identifies products with the highest environmental impact.
-
Product contribution to the total environmental impact
-
Highest and lowest impact products
-
Breakdown by impact category
-
Impact analysis results summary:
-
By Impact category
-
By Life cycle stage
-
By Process
-
-
Major contributors summary
-
Contextual examples translating the physical outputs into easy-to-understand examples (e.g., car journeys, showers, basketball court sizes).
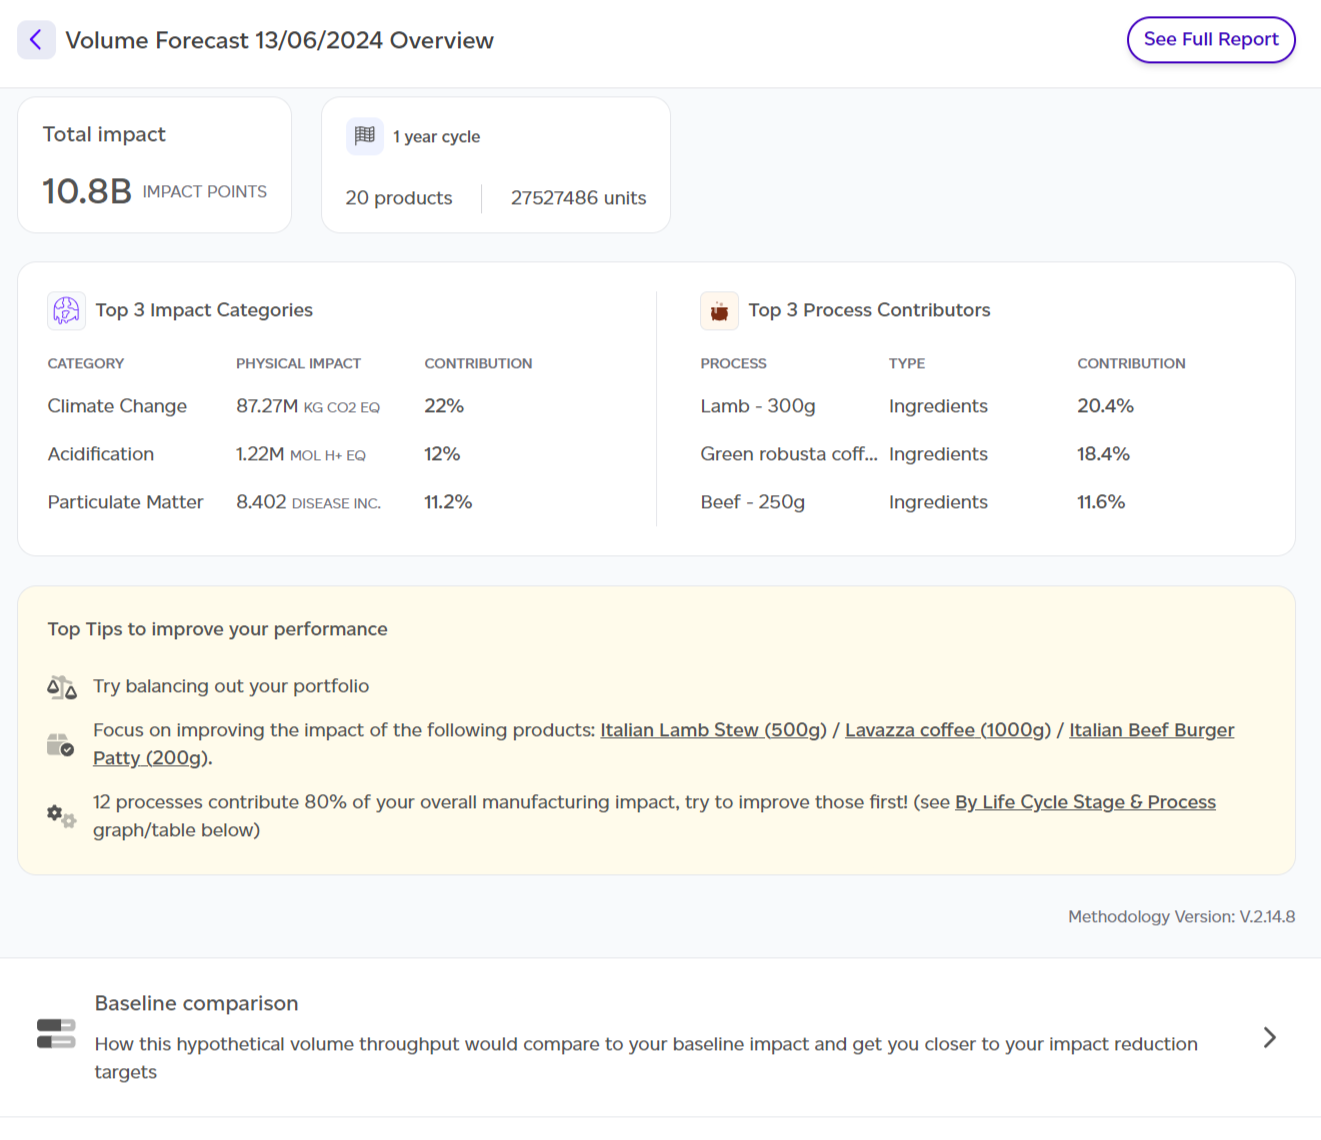
From this dashboard, you can also view the full forecast report. The full report follows a similar structure to other reports but with slight differences in the sections. To access it, click on ‘See Full Report’ at the top.
Full Report Sections:
-
Summary: A quick overview of the assessment, including the number of products, units, and total impact.
-
Volumes: Summarises the expected production volumes used in the forecast.
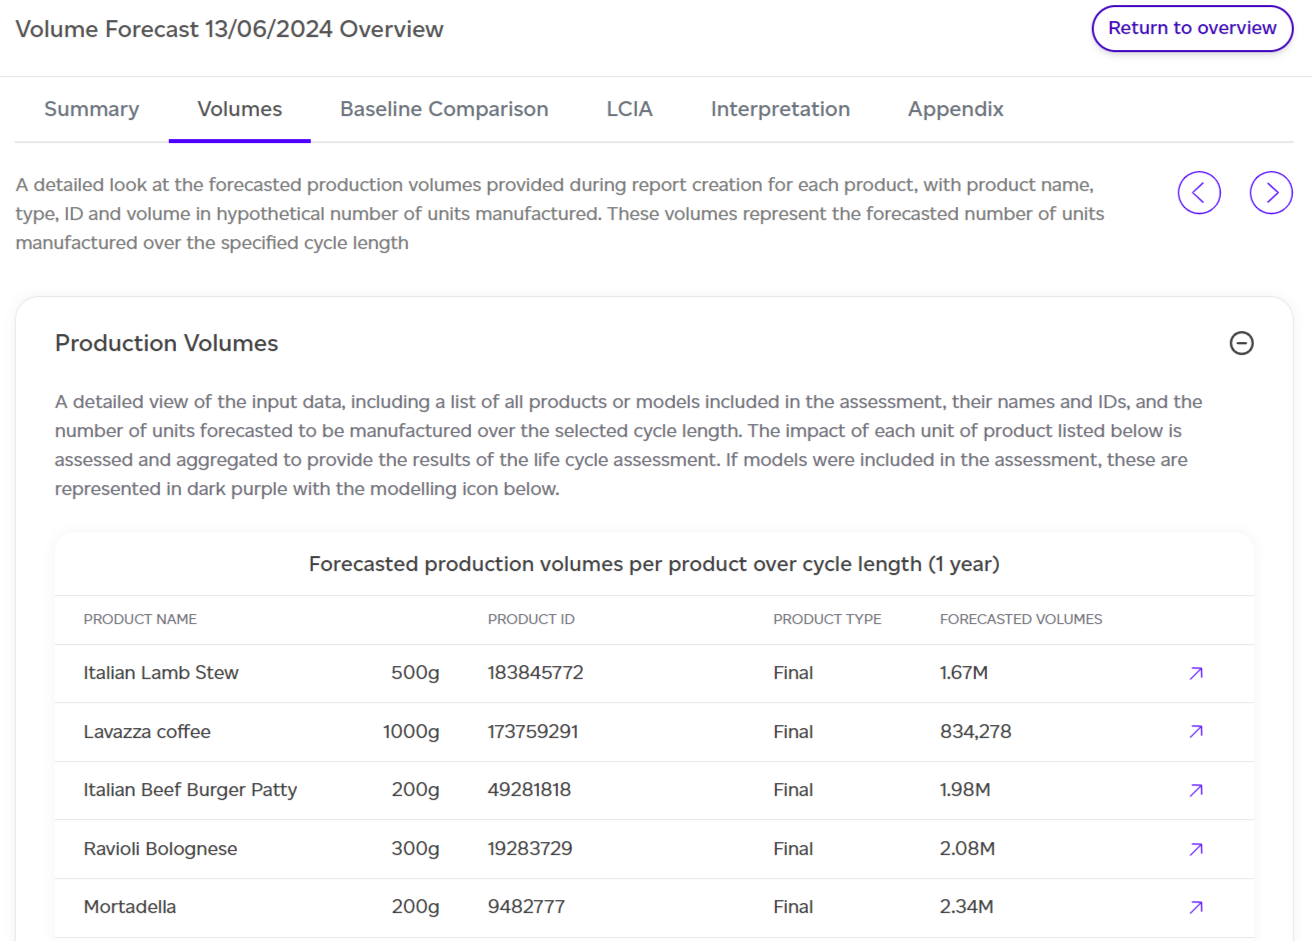
- Baseline comparison: Shows how the forecasted production volumes align with impact reduction targets, comparing the forecasted impact with your baseline to assess if the target will be met.
.png)
-
LCIA (Life Cycle Impact Assessment): A section similar to the product report, with a new ‘impact by product’ lens. Results are split by:
-
Impact by product
-
Impact by category
-
Impact by life cycle stage
-
Impact by process
-
-
As with all reports, the data in tables can be exported as CSV by clicking on ‘Export as CSV’.
-
Interpretation: Provides additional context to the results, including contextual examples to help translate impact data into relatable terms.
-
Appendix: Four appendices provide deeper insights:
-
Detailed breakdown by product
-
Detailed breakdown by impact category
-
Normalisation and weighting factors
-
Assumptions behind the contextual examples
-
-