
Clicking on Volume in the top menu will open a modal with 5 choices.
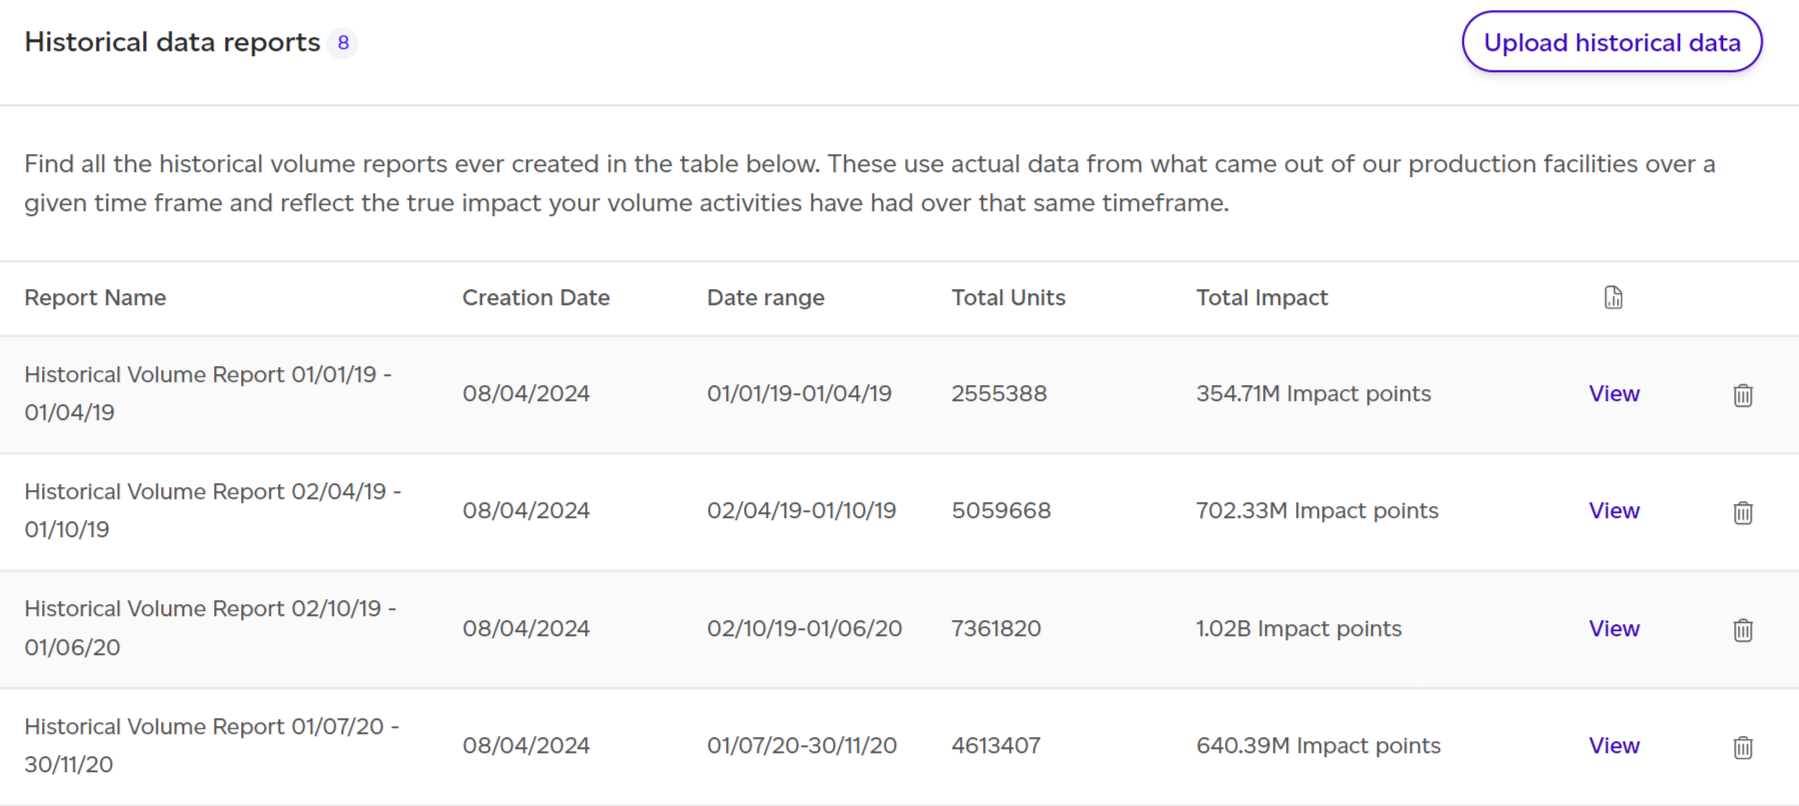
If you click on Historical Reports, you will be redirected to the list of all existing historical reports. If you already have some reports, you can view them by clicking on ‘View’ for the relevant report.
When opening a given report, by default the PEF Production lens will be selected but you can click on GHG Protocol emissions tab to view the historical report using GHG Protocol methodology. This section focuses on the latter.
.png)
The dashboard will summarise the key takeaways of the report:
-
Total emissions estimated (scope 1, 2 and 3)
-
Summary of the number of units produced and the reference year
-
Scope 1 / 2 / 3 breakdown in kg CO2e and %
-
GHG Protocol graph showing the contribution across all scope categories.
-
This can be changed to a table view where biogenic emissions are reported separately, detailed explanations of what is in vs out of scope are presented, and optional reporting categories such as individual emissions as included.
-
Data on this table can be exported as a csv file for further analysis. Simply click on the ‘Export as csv’ button in the right hand corner of the table.
-
It is important to remember that this report covers product-related emissions only and is not intended as a full scope 1, 2 and 3 assessment. Scope 1 an 2 calculations rely mostly on secondary data and as such should be used as reference only.
.png)
From this overview dashboard, you can click on ‘See full report’ to get to the detailed GHG Historical report.
This report follows a similar structure to the GHG Protocol Baseline Report.