
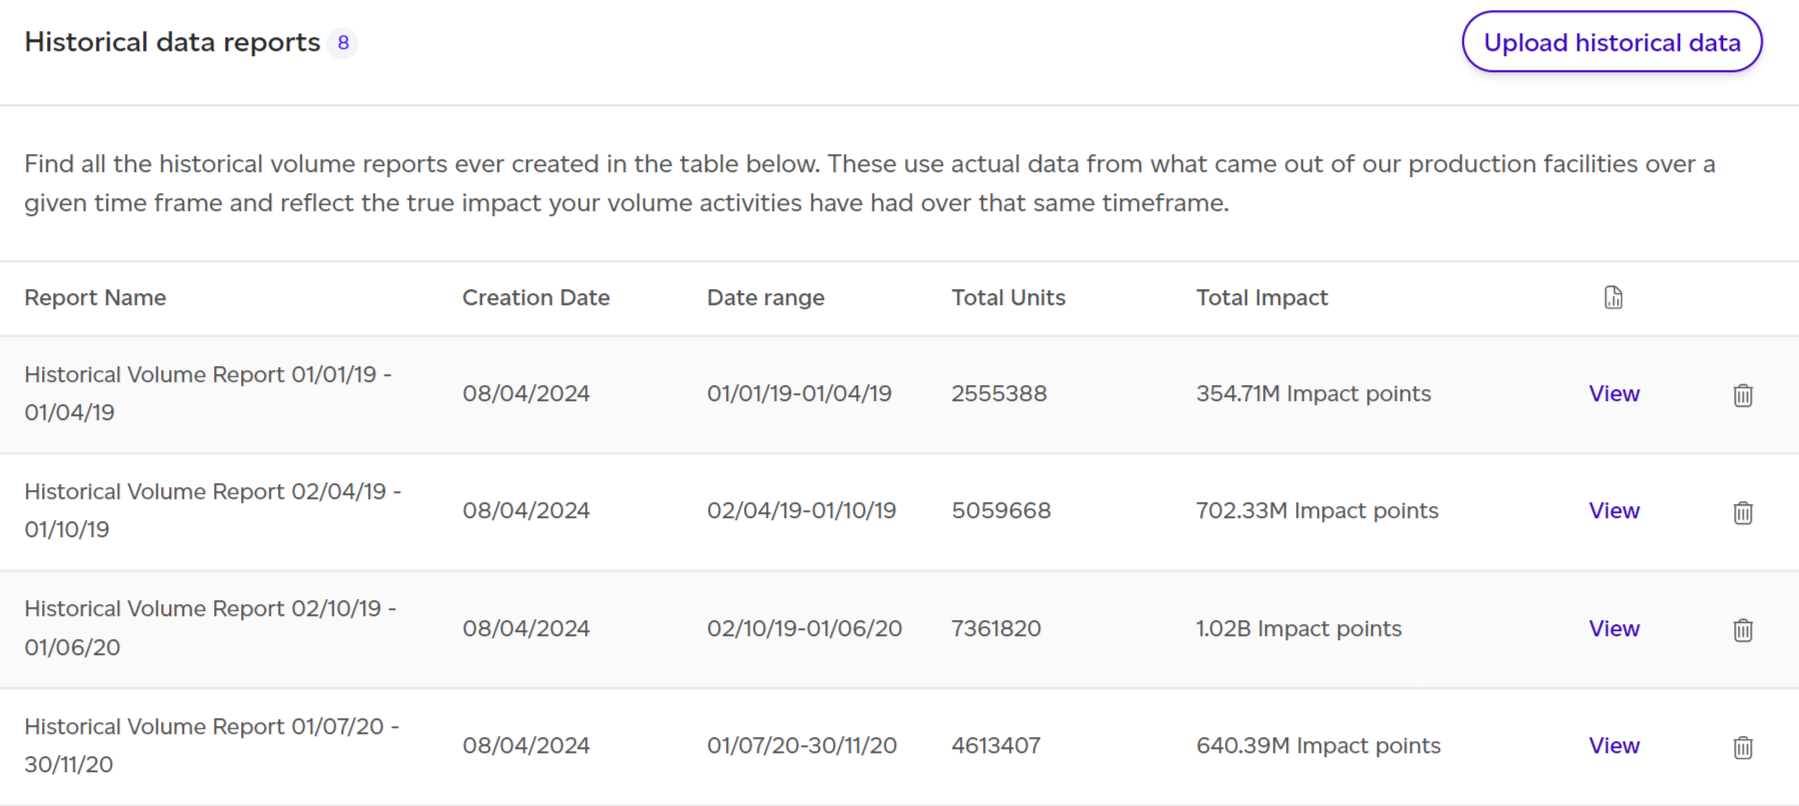
Clicking on Volume in the top menu will open a modal with five options. If you select Historical Reports, you will be redirected to a list of all existing historical reports for your workspace. If you already have reports, you can view them by clicking ‘View’ next to the relevant report.
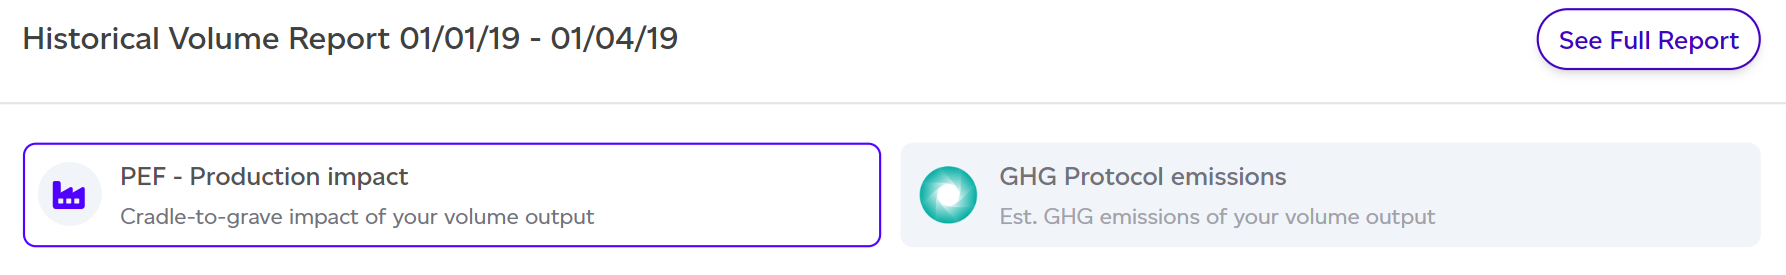
When opening a report, the PEF Production lens will be selected by default. You can switch to the GHG Protocol emissions tab to view the historical report using the GHG Protocol methodology. This article will focus on the PEF Production lens.
The dashboard summarises the key takeaways from the report:
-
Total environmental impact of the manufacturing output
-
Actual manufacturing throughput overview: This includes the total number of product SKUs in the analysis, the total number of units (for all SKUs combined), and the date range.
-
Top 3 impact categories and processes
-
Top 3 tips to improve your manufacturing output score
-
Contextual examples translating the physical outputs into easy-to-understand comparisons
-
Progress tracking: A graph showing progress from the baseline, highlighting any previously uploaded historical data and targets, with the historical data point of the report for context. An estimated impact reduction trendline will also indicate your success towards meeting the target.
-
Worst offenders: A breakdown of the worst-performing products contributing to the environmental impact.
-
Product SKU contribution: Overview of each product's contribution to the total environmental impact.
-
Highest and lowest impact products
-
Breakdown by impact category, life cycle stage, and process
-
Major contributors summary
-
Contextual examples to translate the physical impact difference into relatable terms (e.g. car journeys, showers, basketball court sizes).
.png)
From this overview, you can click ‘See Full Report’ to access the full, detailed report.
This report is divided into multiple sections, each shown within its own tab. You can switch between tabs by clicking on them or by using the ‘Next’ button at the bottom of each tab. The structure is very similar to the baseline report, with a dedicated Progress Tracking section.
-
Summary: A quick overview of the assessment, including the number of products, units, and total impact.
-
Volumes: Summarises the production volumes used in the report.
-
Progress tracking: Provides a summary of progress up to the report’s timeframe, showing the baseline, any previous historical data points, and targets. It also evaluates how likely you are to meet your targets.
.png)
-
LCIA (Life Cycle Impact Assessment): This section mirrors the baseline report but includes a new ‘impact by product’ lens, with results split by:
-
Impact by product
-
Impact by category
-
Impact by life cycle stage
-
Impact by process
-
As with other reports, data tables can be exported as CSV by clicking on ‘Export as CSV’.
-
Interpretation: This section provides additional context, helping you understand the results with contextual examples, such as comparisons to common activities like car journeys or showers.
-
Appendix: Four appendices are included:
-
Detailed breakdown by product
-
Detailed breakdown by impact category
-
Normalisation and weighting factors
-
Assumptions behind the contextual examples
-